What the Metrics Reveal About U.S. Sports Betting’s Next Chapter

By Stephen A. Crystal, Founder & CEO, SCCG Management
The U.S. sports betting industry reached an unprecedented milestone in 2024. For those of us who have been in this space for decades, the numbers not only validate the trajectory we’ve anticipated, but also highlight the urgency of adapting to a more nuanced and competitive landscape.
The Numbers Tell the Story: $149 Billion in Handle
In 2024, Americans legally wagered nearly $149 billion across 38 regulated markets. That’s a 23% increase over 2023’s figures, driven by both the expansion of legal betting jurisdictions and deepening market penetration in mature states. Even more telling? Sportsbooks earned $13.7 billion in gross gaming revenue (GGR), with a nationwide hold of 9.2% and a state tax windfall of $2.8 billion. This is no longer an emerging vertical — it’s a central pillar of American gaming.
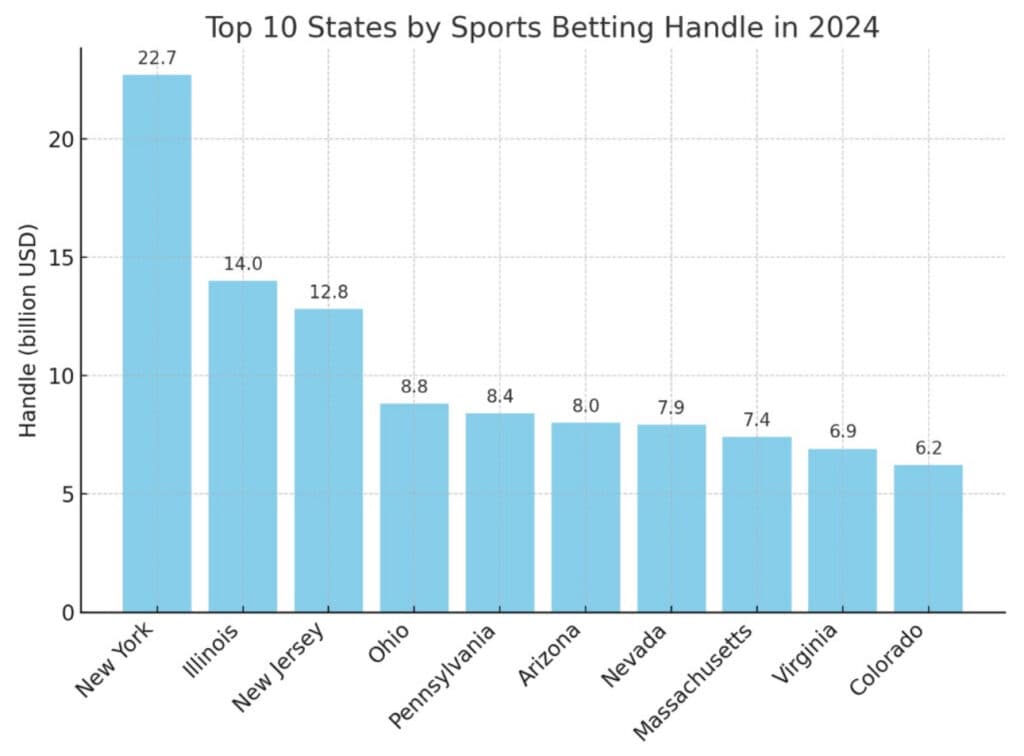
New York led the pack with $22.7 billion wagered, followed by Illinois ($14B) and New Jersey ($12.8B). Meanwhile, states like Massachusetts ($7.4B handle, up 48%) prove that new markets can scale rapidly if infrastructure and consumer trust are in place.
Football Reigns Supreme, But In-Play is the Real Growth Engine
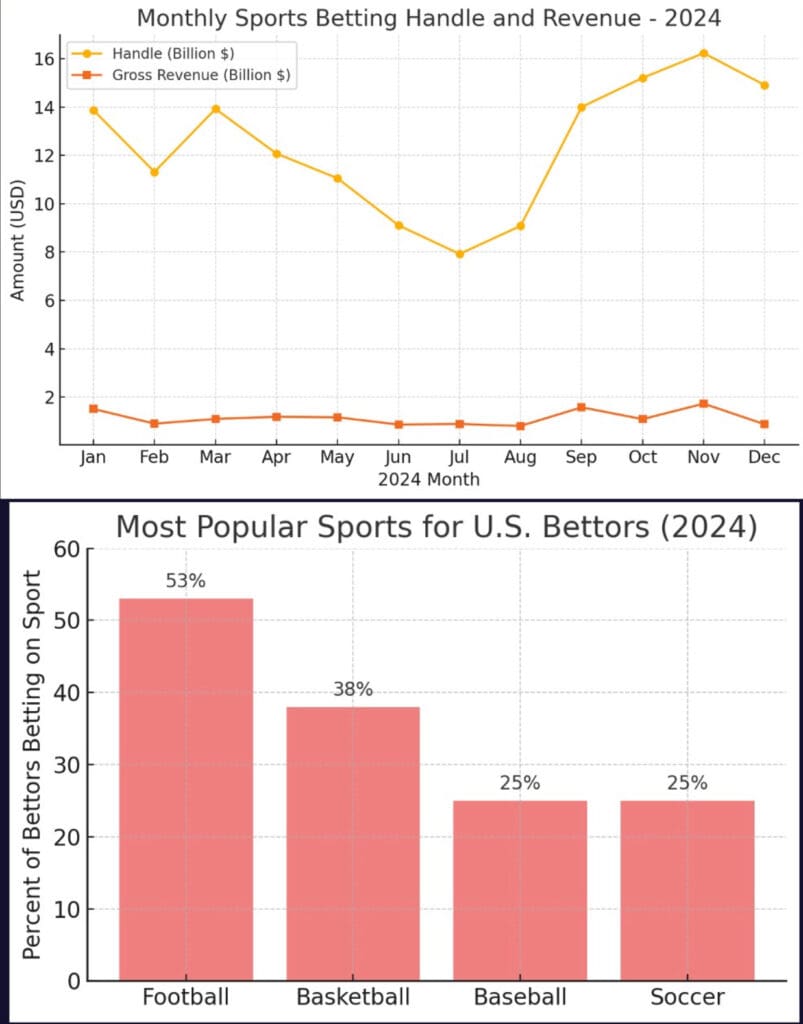
More than half of U.S. bettors placed a wager on football in 2024. Basketball, baseball, and soccer followed, but what’s truly reshaping the economics of betting is the type of wagers being made.
Same-game parlays, with their high hold percentages, have become a goldmine for operators. In markets like New Jersey, parlays represented just a quarter of the handle but over half of the revenue. And in-play betting officially overtook pre-game wagers, accounting for 52% of all bets. Bettors who engaged in live wagering spent 87% more per month, on average. This signals a transformation in user engagement that sportsbooks must lean into with real-time data tools and dynamic pricing.
Seasonal Trends and the Peak Months
The fall surge in betting handle is no surprise, with October and November each clearing $15 billion. But even more intriguing is how consistent revenue growth was throughout the year, especially in months like July and September, where higher parlay win rates and underdog upsets boosted sportsbook hold to over 11%. These spikes demonstrate how operator margins remain heavily influenced by bettor behavior and event outcomes.
Revenue Leadership and Parlay Dominance
Revenue figures largely followed handle patterns. New York took in $2.05 billion in GGR with a staggering $1 billion in taxes thanks to its 51% online tax rate. Illinois and New Jersey posted solid results as well, while Nevada saw revenue rise 14% despite a dip in handle — a testament to improved hold efficiency.
Parlays remain the profit engine. In Nevada, traditional straight wagers held between 5-7%, but parlays approached a 14.5% win rate. New Jersey pulled in over $530 million in parlay revenue. This is where the battle for user education and promotion intensity will continue to heat up.
Who’s Betting? And How Much?
An estimated 50–60 million American adults placed a sports bet in 2024. That’s about 20% of the adult population, and we expect that number to climb. But it’s how they’re betting that matters:
- High Rollers (>$10K/year): Roughly 5% of bettors but a disproportionate share of handle.
- Mid-Range ($1K–$10K): About 20–30%, consistent and reliable revenue contributors.
- Casual (<$1K): The majority (60%+), often engaged during peak sports events.
While the average bettor spent $3,300, the median spend was just $750, underscoring how skewed the economics are toward whales and frequent users. Understanding these segments will be critical to acquisition, retention, and responsible gaming strategies.
Demographics: The Modern U.S. Sports Bettor
The dominant profile is a male aged 25–34, but the gap is narrowing. One in four men bet, compared to 15% of women — a number that’s growing. Betting also spans income levels equally, though volume differs. Notably, participation is highest among Hispanic and Black communities, and slightly lower among Asian Americans. In short: betting is now mainstream across America.
Looking Ahead: Strategic Takeaways
As operators, regulators, and advisors, our mandate is clear:
- Invest in Live Betting Infrastructure: It’s where user engagement and revenue growth are headed.
- Optimize Parlay Education: High-margin, yes, but also high-risk. Transparency and intelligent UX design matter.
- Balance Promotions with Profitability: The promo wars are far from over, especially in newer markets.
- Prepare for Regulation 2.0: Tax, integrity, and advertising scrutiny will intensify as growth plateaus.
At SCCG, we see 2024 not as the peak, but as a critical inflection point. The market is bigger, smarter, and more competitive than ever. The winners in this next phase won’t just be the biggest brands, but those with the clearest strategies.
Live betting and parlay volume are reshaping operator margins; infrastructure and regulatory agility separate winners from the rest.
We're watching the market mature in real time. The shift to in-play and parlays isn't just a trend—it's how bettors engage now. Operators who don't upgrade their live infrastructure and parlay optimization will lose share to those who do. The regulatory environment is moving faster than many anticipated.
- Handle hit $149B in 2024 (23% YoY growth); in-play and parlays now driving volume over traditional straight bets
- New York, Illinois, New Jersey dominate, but newer markets like Massachusetts scaling fast at 48% growth
- 9.2% nationwide hold and $2.8B in state tax revenue make this a core pillar of regulated gaming
SCCG angle: We've got 30+ years and 150+ partners across every regulated market. If your live betting stack or parlay pricing isn't keeping pace with this 23% surge, let's connect you with operators and vendors already ahead of this curve—real peers doing this now, in your region.
Gaming, betting and prediction markets — the desk’s read, every weekday.
Subscribe →